

Hubble and Gemini Watch From Afar, Capturing High-Resolution Global Views of Jupiter That Are Key to Interpreting Juno’s Close-Up Observations of the Planet.
A look With thunderheads that tower forty miles high and stretch half the width of a continent, hurricane-force winds in enormous storms that rage for centuries, and lightning three times as powerful as Earth’s strongest superbolts, Jupiter—king of the planets—has proven itself a more-than-worthy namesake to the supreme Roman god of sky and thunder.
In spite of more than 400 years of scientific observations, many details of the gas giant’s turbulent and ever-changing atmosphere have remained elusive. Now, thanks to the teamwork of the Hubble Space Telescope, the Gemini Observatory, and the Juno spacecraft, scientists are able to probe deep into storm systems, investigating sources of lightning outbursts, mapping cyclonic vortices, and unravelling the nature of enigmatic features within the Great Red Spot.
This unique collaboration is allowing researchers to monitor Jupiter’s weather and estimate the amount of water in the atmosphere, providing insight into how Jupiter operates today as well as how it and the other planets in our solar system formed more than four-and-a-half billion years ago.
NASA’s Hubble Space Telescope and the ground-based Gemini Observatory in Hawaii have teamed up with the Juno spacecraft to probe the mightiest storms in the solar system, taking place more than 500 million miles away on the giant planet Jupiter.
A team of researchers led by Michael Wong at the University of California, Berkeley, and including Amy Simon of NASA’s Goddard Space Flight Center in Greenbelt, Maryland, and Imke de Pater also of UC Berkeley, are combining multiwavelength observations from Hubble and Gemini with close-up views from Juno’s orbit about the monster planet, gaining new insights into turbulent weather on this distant world.
“We want to know how Jupiter’s atmosphere works,” said Wong. This is where the teamwork of Juno, Hubble and Gemini comes into play.
Radio ‘Light Show’
Jupiter’s constant storms are gigantic compared to those on Earth, with thunderheads reaching 40 miles from base to top — five times taller than typical thunderheads on Earth — and powerful lightning flashes up to three times more energetic than Earth’s largest “superbolts.”
Like lightning on Earth, Jupiter’s lightning bolts act like radio transmitters, sending out radio waves as well as visible light when they flash across the sky.
Every 53 days, Juno races low over the storm systems detecting radio signals known as “sferics” and “whistlers,” which can then be used to map lightning even on the day side of the planet or from deep clouds where flashes are not otherwise visible.
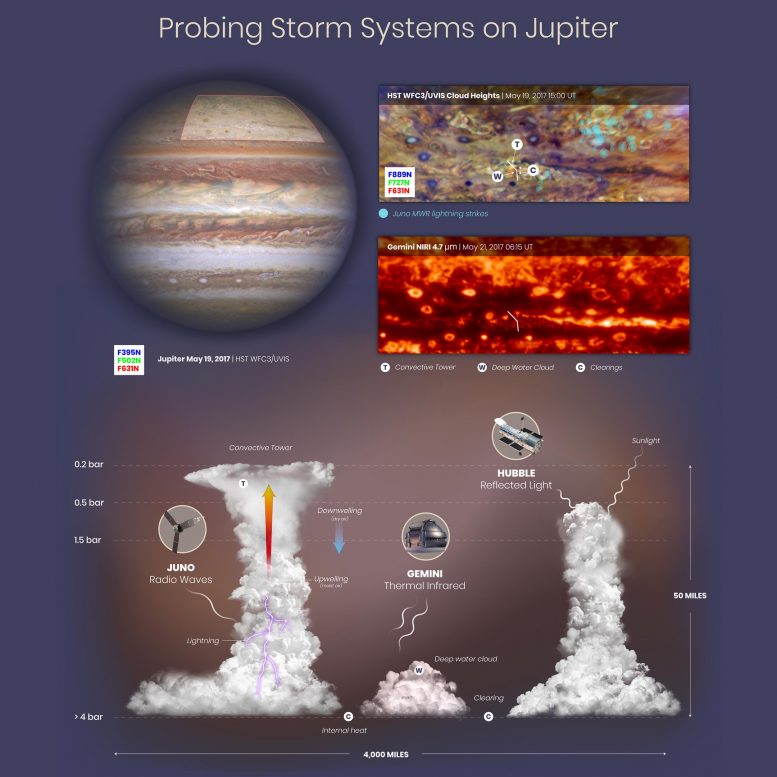
Coinciding with each pass, Hubble and Gemini watch from afar, capturing high-resolution global views of the planet that are key to interpreting Juno’s close-up observations. “Juno’s microwave radiometer probes deep into the planet’s atmosphere by detecting high-frequency radio waves that can penetrate through the thick cloud layers. The data from Hubble and Gemini can tell us how thick the clouds are and how deep we are seeing into the clouds,” Simon explained.
By mapping lightning flashes detected by Juno onto optical images captured of the planet by Hubble and thermal infrared images captured at the same time by Gemini, the research team has been able to show that lightning outbreaks are associated with a three-way combination of cloud structures: deep clouds made of water, large convective towers caused by upwelling of moist air — essentially Jovian thunderheads — and clear regions presumably caused by downwelling of drier air outside the convective towers.
The Hubble data show the height of the thick clouds in the convective towers, as well as the depth of deep water clouds. The Gemini data clearly reveal the clearings in the high-level clouds where it is possible to get a glimpse down to the deep water clouds.
Wong thinks that lightning is common in a type of turbulent area known as folded filamentary regions, which suggests that moist convection is occurring in them. “These cyclonic vortices could be internal energy smokestacks, helping release internal energy through convection,” he said. “It doesn’t happen everywhere, but something about these cyclones seems to facilitate convection.”
The ability to correlate lightning with deep water clouds also gives researchers another tool for estimating the amount of water in Jupiter’s atmosphere, which is important for understanding how Jupiter and the other gas and ice giants formed, and therefore how the solar system as a whole formed.
While much has been gleaned about Jupiter from previous space missions, many of the details — including how much water is in the deep atmosphere, exactly how heat flows from the interior and what causes certain colors and patterns in the clouds — remain a mystery. The combined result provides insight into the dynamics and three-dimensional structure of the atmosphere.
Seeing a ‘Jack-O-Lantern’ Red Spot
With Hubble and Gemini observing Jupiter more frequently during the Juno mission, scientists are also able to study short-term changes and short-lived features like those in the Great Red Spot.
Images from Juno as well as previous missions to Jupiter revealed dark features within the Great Red Spot that appear, disappear and change shape over time. It was not clear from individual images whether these are caused by some mysterious dark-colored material within the high cloud layer, or if they are instead holes in the high clouds — windows into a deeper, darker layer below.
Now, with the ability to compare visible-light images from Hubble with thermal infrared images from Gemini captured within hours of each other, it is possible to answer the question. Regions that are dark in visible light are very bright in infrared, indicating that they are, in fact, holes in the cloud layer. In cloud-free regions, heat from Jupiter’s interior that is emitted in the form of infrared light — otherwise blocked by high-level clouds — is free to escape into space and therefore appears bright in Gemini images.
“It’s kind of like a jack-o-lantern,” said Wong. “You see bright infrared light coming from cloud-free areas, but where there are clouds, it’s really dark in the infrared.”
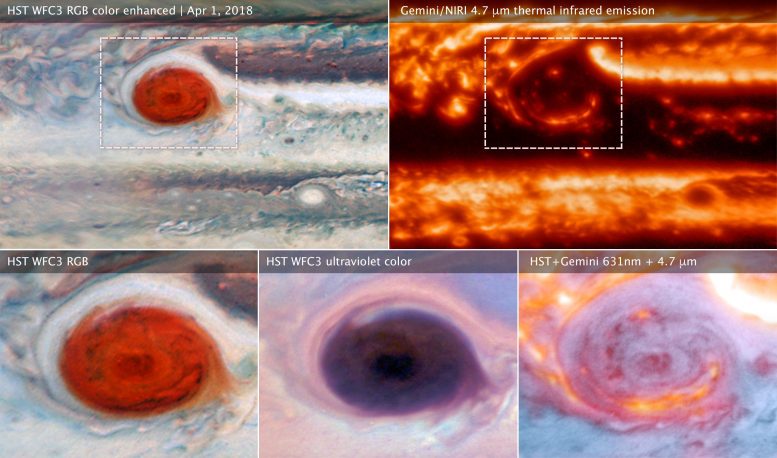
The above images of Jupiter’s Great Red Spot were made using data collected by the Hubble Space Telescope and the Gemini Observatory on April 1, 2018. By combining observations captured at almost the same time from the two different observatories, astronomers were able to determine that dark features on the Great Red Spot are holes in the clouds rather than masses of dark material.
Upper left (wide view) and lower left (detail): The Hubble image of sunlight (visible wavelengths) reflecting off clouds in Jupiter’s atmosphere shows dark features within the Great Red Spot.
Upper right: A thermal infrared image of the same area from Gemini shows heat emitted as infrared energy. Cool overlying clouds appear as dark regions, but clearings in the clouds allow bright infrared emission to escape from warmer layers below.
Lower middle: An ultraviolet image from Hubble shows sunlight scattered back from the hazes over the Great Red Spot. The Great Red Spot appears red in visible light because these hazes absorb blue wavelengths. The Hubble data show that the hazes continue to absorb even at shorter ultraviolet wavelengths.
Lower right: A multiwavelength composite of Hubble and Gemini data shows visible light in blue and thermal infrared in red. The combined observations show that areas that are bright in infrared are clearings or places where there is less cloud cover blocking heat from the interior.
The Hubble and Gemini observations were made to provide a wide-view context for Juno’s 12th pass (Perijove 12).
Hubble and Gemini as Jovian Weather Trackers
The regular imaging of Jupiter by Hubble and Gemini in support of the Juno mission is proving valuable in studies of many other weather phenomena as well, including changes in wind patterns, characteristics of atmospheric waves and the circulation of various gases in the atmosphere.
Hubble and Gemini can monitor the planet as a whole, providing real-time base maps in multiple wavelengths for reference for Juno’s measurements in the same way that Earth-observing weather satellites provide context for NOAA’s high-flying Hurricane Hunters.
“Because we now routinely have these high-resolution views from a couple of different observatories and wavelengths, we are learning so much more about Jupiter’s weather,” explained Simon. “This is our equivalent of a weather satellite. We can finally start looking at weather cycles.”
Because the Hubble and Gemini observations are so important for interpreting Juno data, Wong and his colleagues Simon and de Pater are making all of the processed data easily accessible to other researchers through the Mikulski Archives for Space Telescopes (MAST) at the Space Telescope Science Institute in Baltimore, Maryland.
“What’s important is that we’ve managed to collect this huge data set that supports the Juno mission. There are so many applications of the data set that we may not even anticipate. So, we’re going to enable other people to do science without that barrier of having to figure out on their own how to process the data,” Wong said.
The results were published in April 2020 in The Astrophysical Journal Supplement Series.


![Hotstar Premium Cookies 2019 [*100% Working & Daily Updated*]](https://tahav.com/wp-content/uploads/2019/11/Hotstar-Premium-Cookies-Free-100x70.jpg "Hotstar Premium Cookies 2019 [*100% Working & Daily Updated*]")


